Results
Receipts, not rounded-up averages.
Pulled straight from client Shopify dashboards. Brand names redacted — the numbers are exactly what the dashboard shows.
Receipts
Straight from the dashboard.
Unedited Shopify screenshots from accounts we still run. Brand names redacted. The numbers are exactly what the dashboard shows. Hover any tile for the window it was earned in.
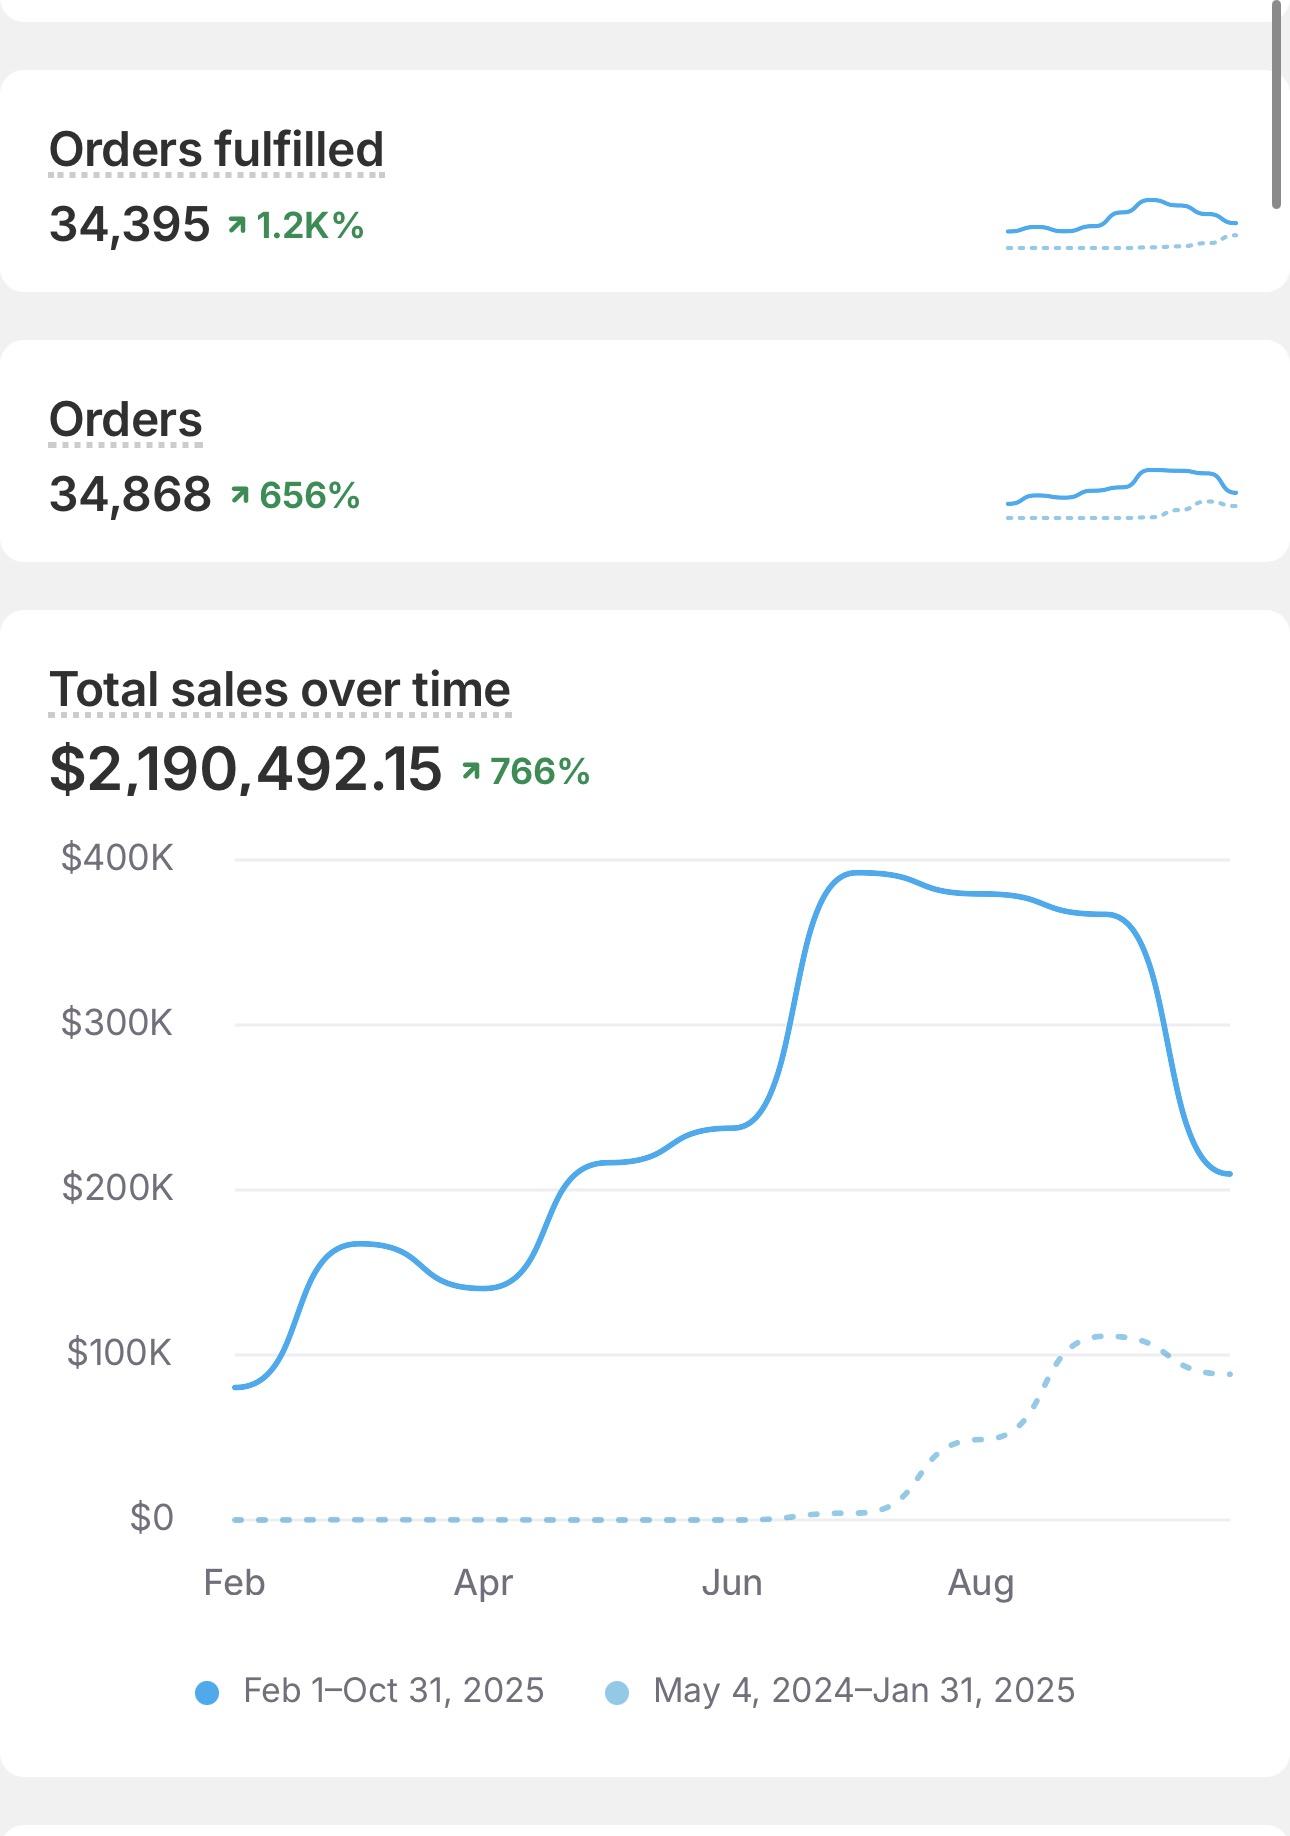
Shopify · Feb–Oct 2025
$2,190,492.15 total sales, +766%
ShopifyFeb–Oct 2025
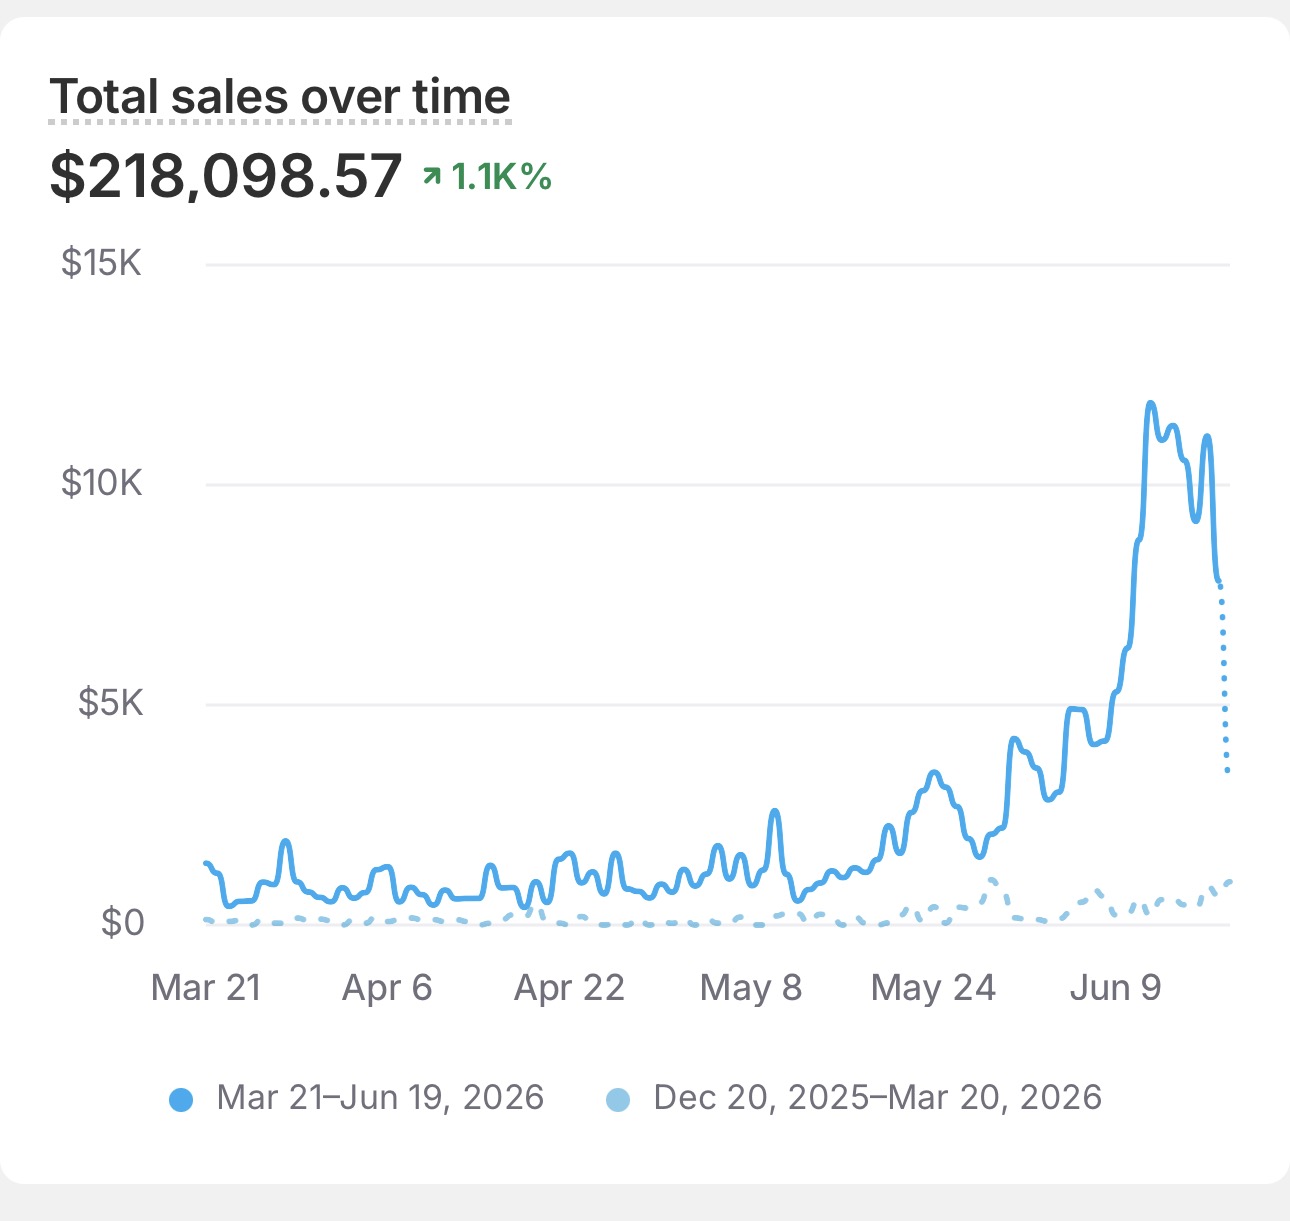
Shopify · Mar–Jun 2026
$218,098.57 total sales, +1.1k%
ShopifyMar–Jun 2026
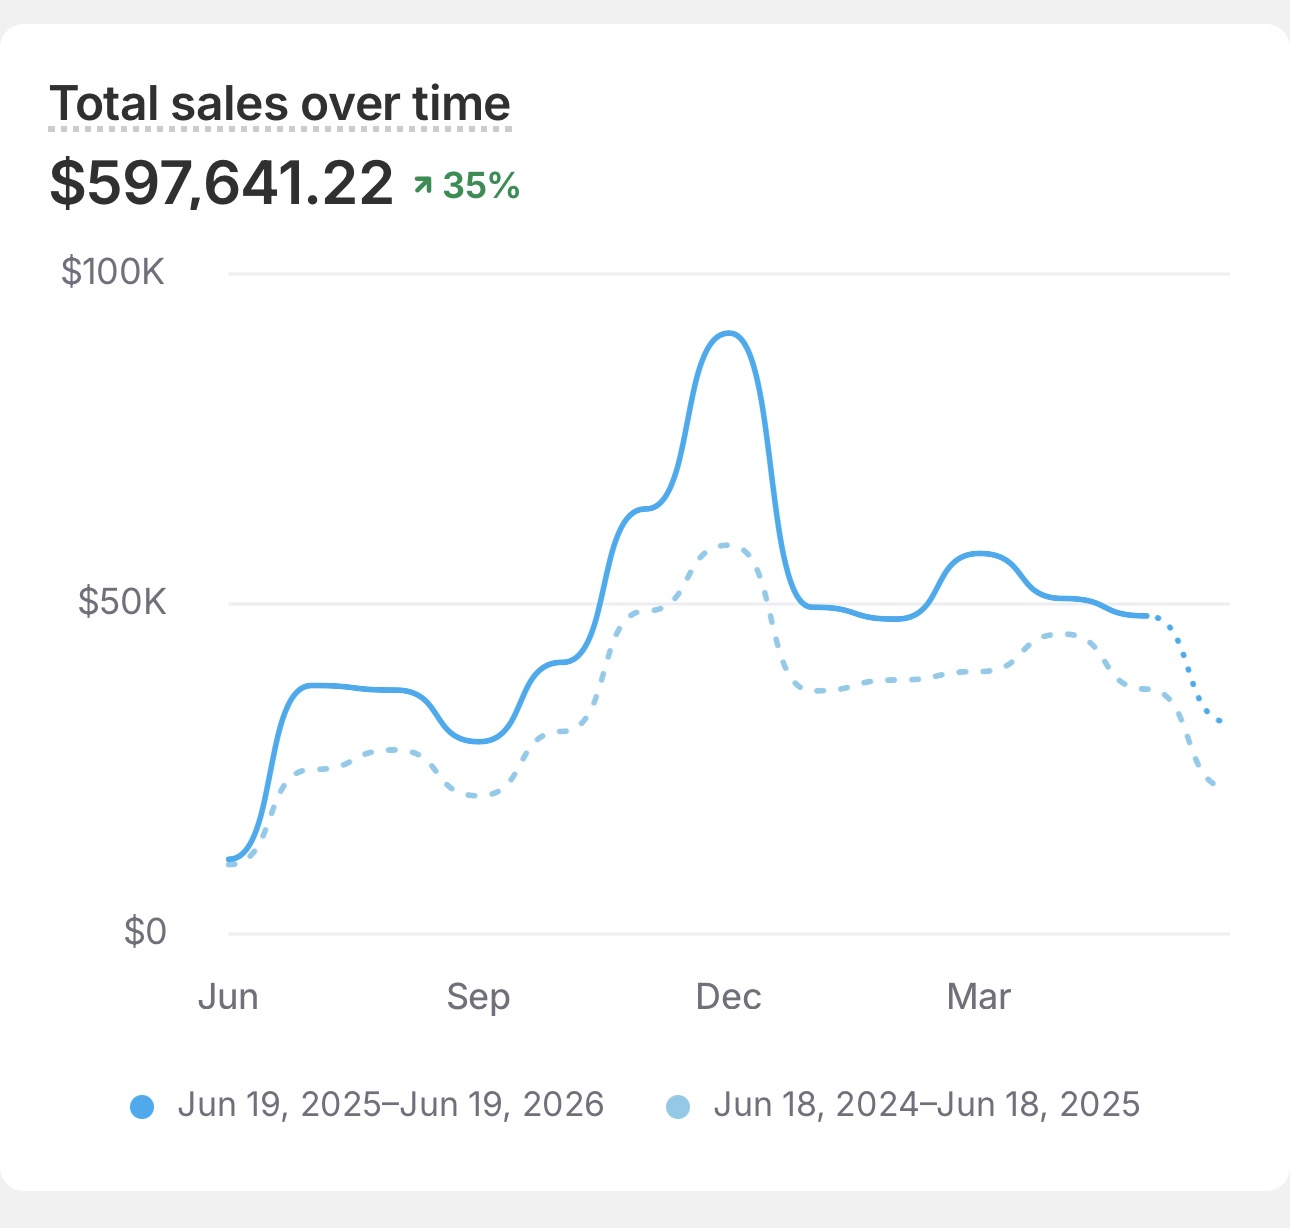
Shopify · Jun 2025–Jun 2026
$597,641.22 total sales, +35%
ShopifyJun 2025–Jun 2026
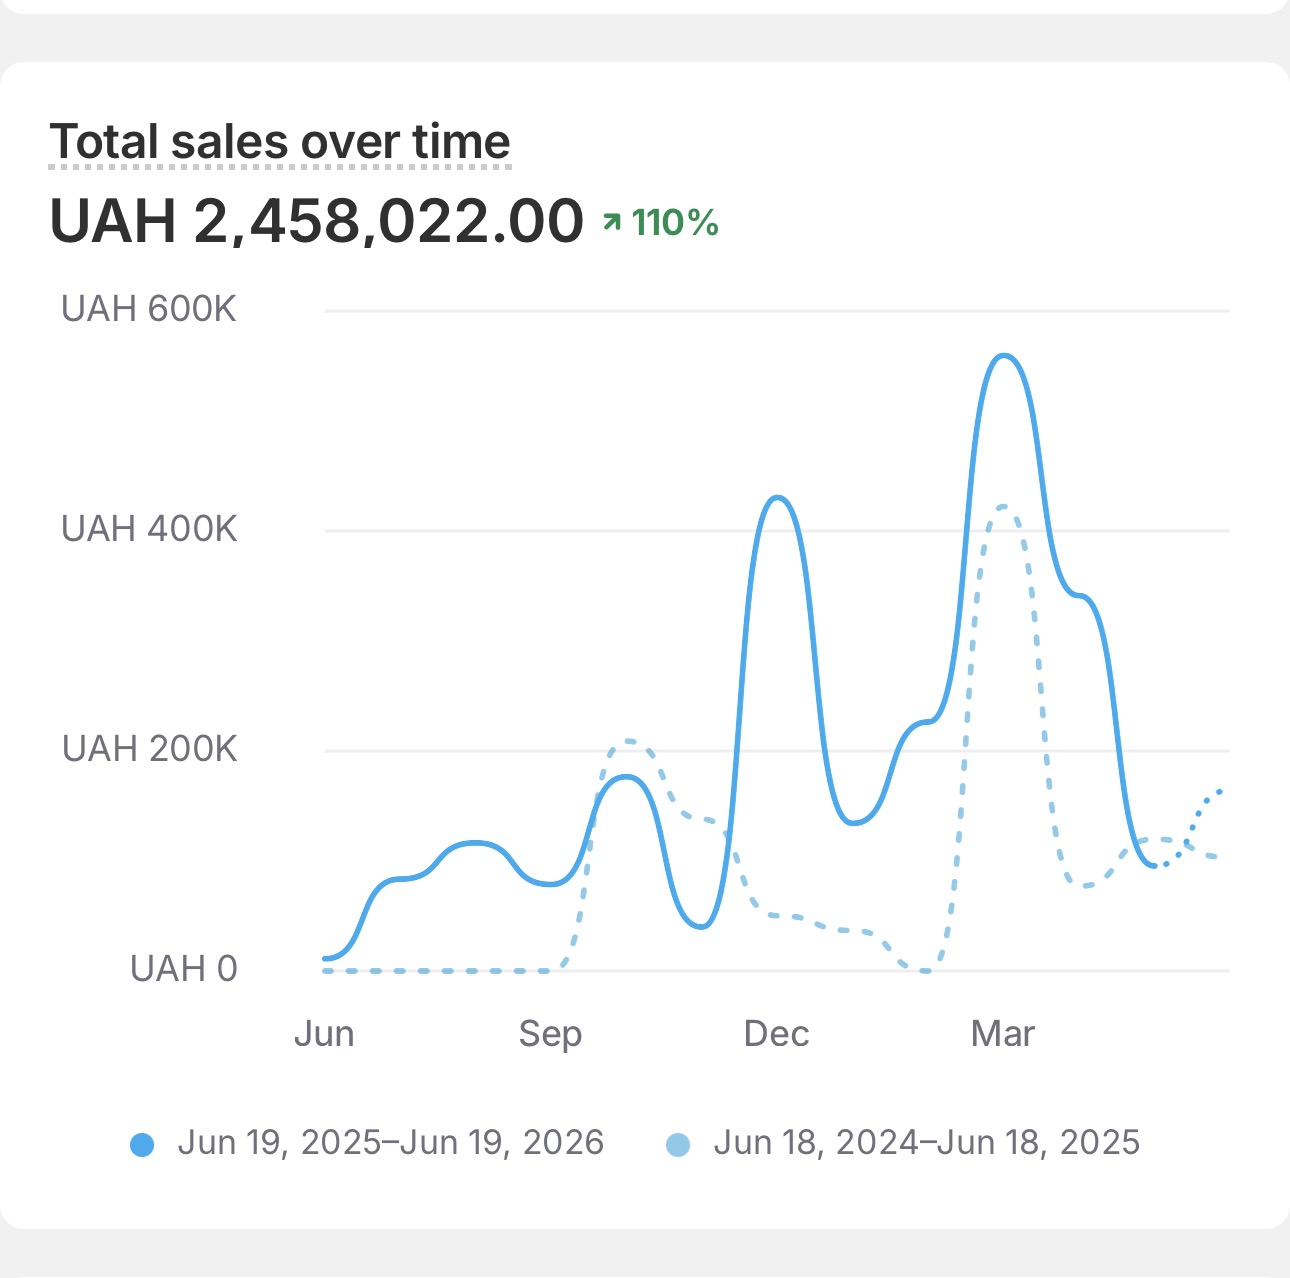
Shopify · Jun 2025–Jun 2026
UAH 2,458,022 total sales, +110%
ShopifyJun 2025–Jun 2026
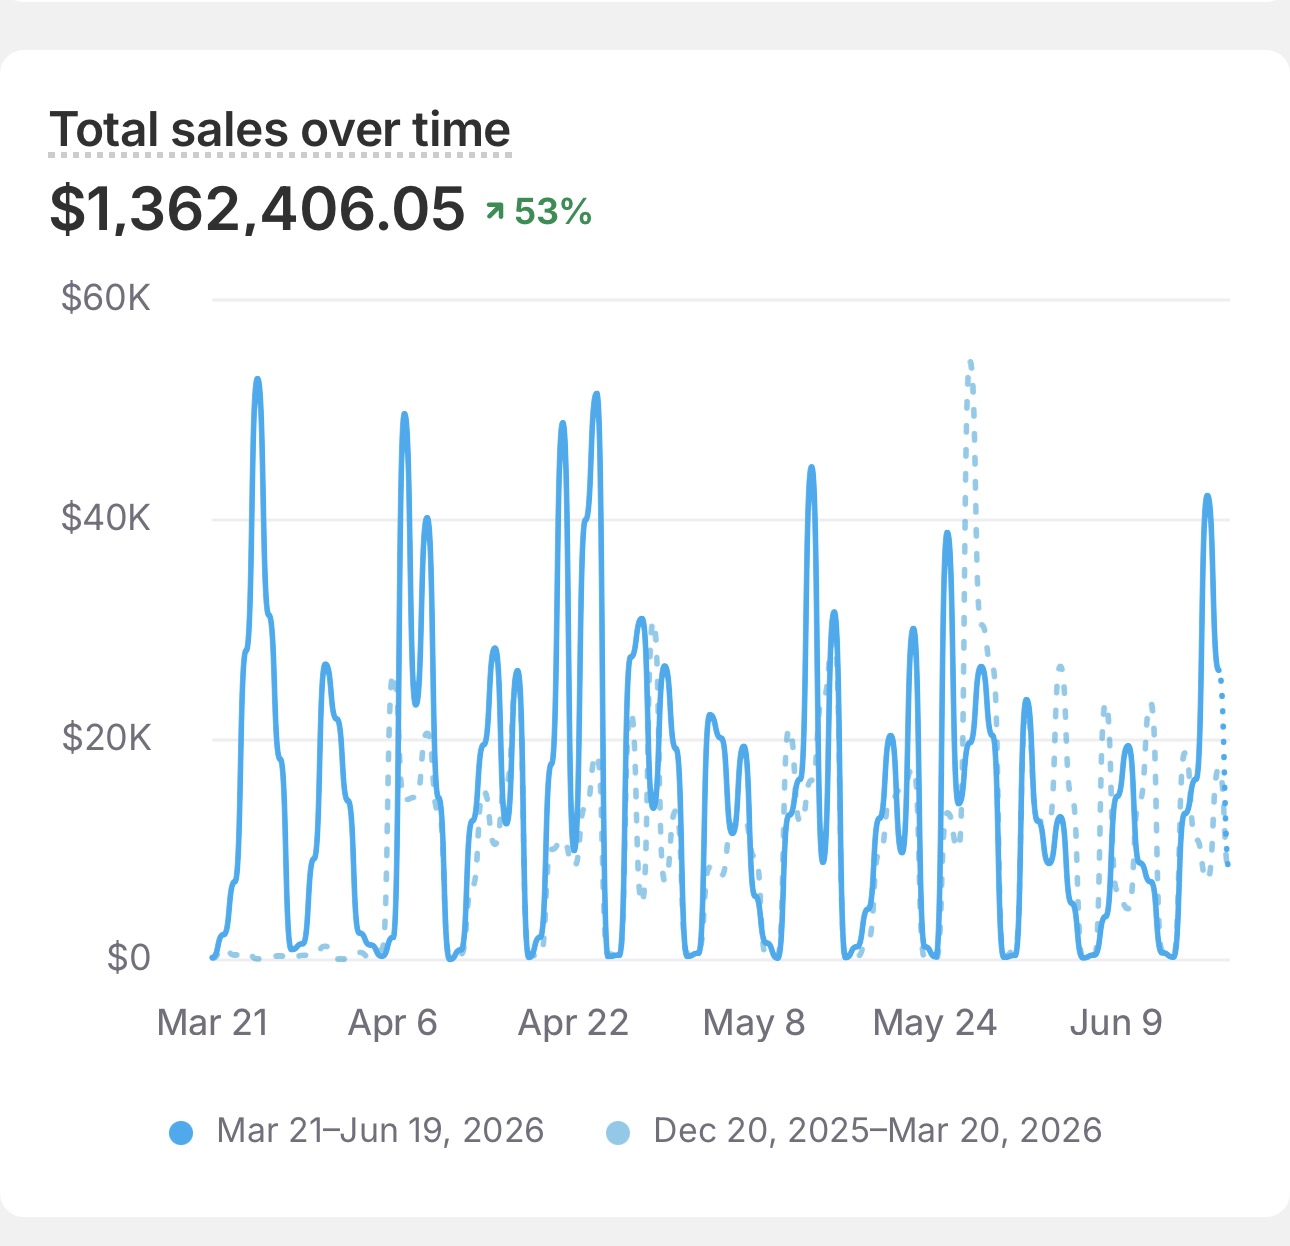
Shopify · Mar–Jun 2026
$1,362,406.05 total sales, +53%
ShopifyMar–Jun 2026
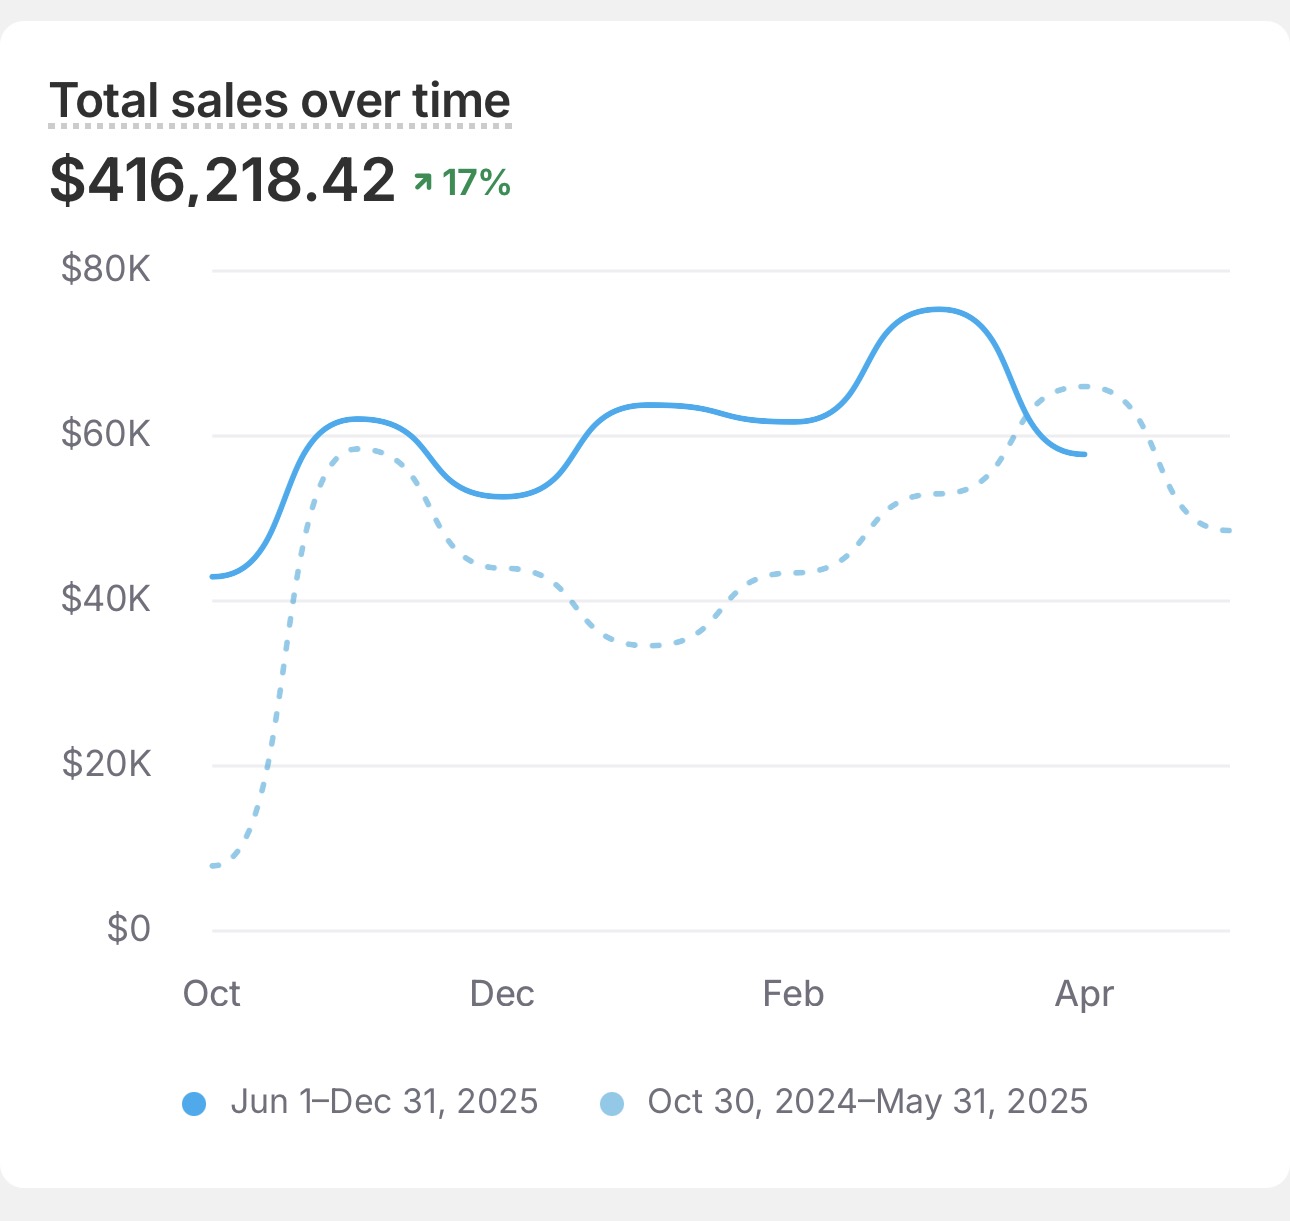
Shopify · Jun–Dec 2025
$416,218.42 total sales, +7%
ShopifyJun–Dec 2025
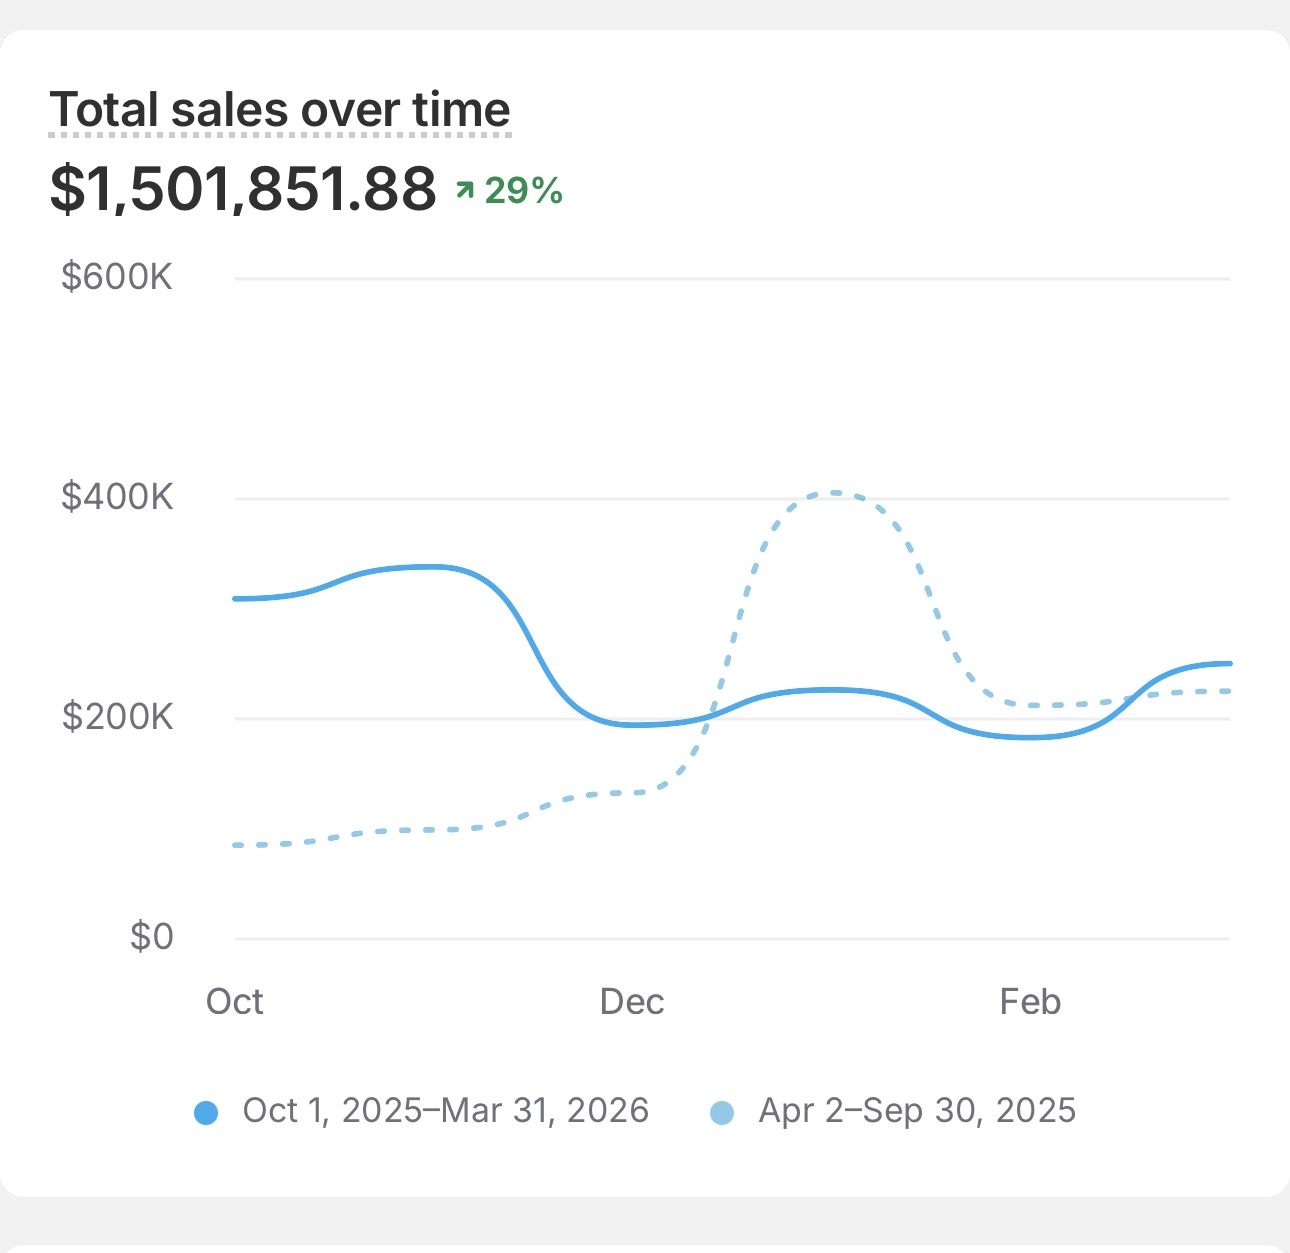
Shopify · Oct 2025–Mar 2026
$1,501,851.88 total sales, +29%
ShopifyOct 2025–Mar 2026
Names redacted. Numbers are exactly what the dashboard shows. Reference calls available on request.
By vertical
Performance across categories we operate in.
Vertical
Avg. ROAS
Avg. CAC change
Apparel & accessories
3.4x
−42%
Beauty & skincare
2.9x
−31%
Home & lifestyle
3.1x
−28%
Health & supplements
2.6x
−45%
Consumer electronics
2.4x
−22%
Food & beverage
3.0x
−36%
Founders on us:
What founders say after the second invoice.
Operator-to-operator notes from founders we've actually run accounts for. No screenshots, no badges, no third-party platform. Just the words they used.
Avg.5.0
Across every account we still run
Founders who renewed past month 3. Reach-outs available on request.
Real client testimonials go here as we collect signed-off quotes — ask for references on your strategy call.