Jersey Club FootballFrom $26K to $211K in 30 days
Stalled Facebook account, one channel, tournament window closing. We rebuilt the creative pipeline instead of just spending more.

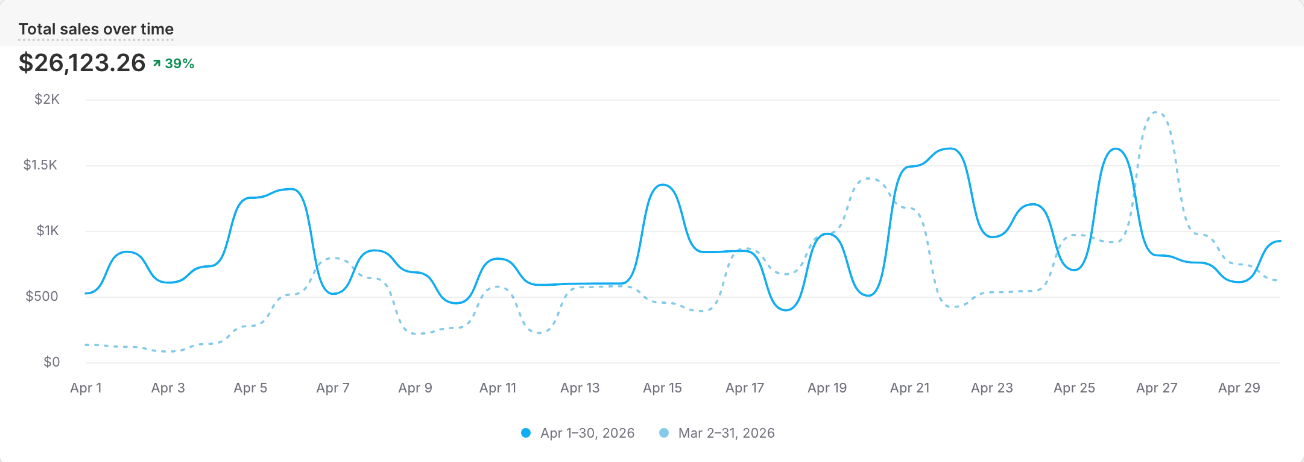
Shopify total sales · April 2026
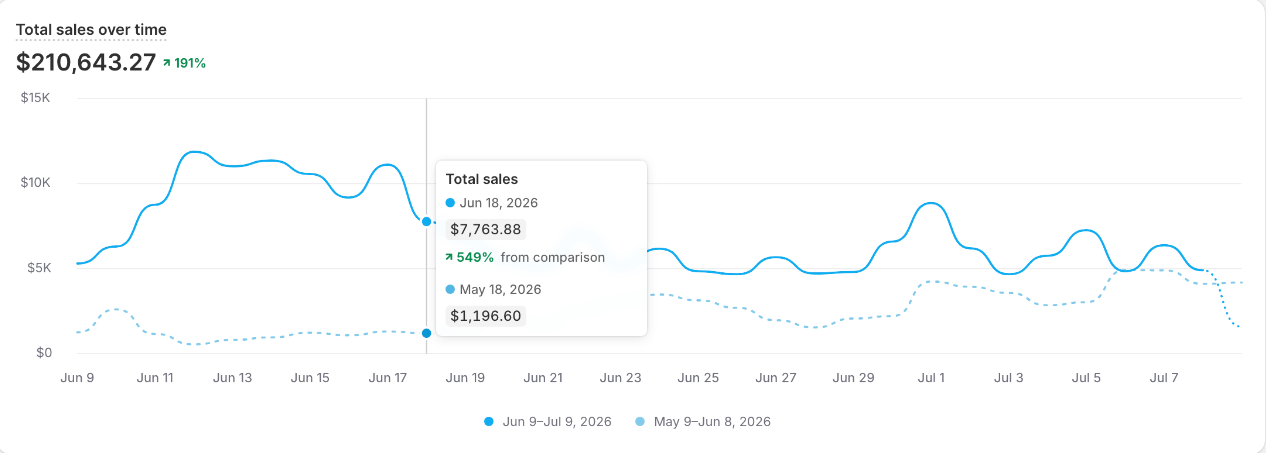
Shopify total sales · Jun 9–Jul 9, 2026
Growth
vs. prior 30 days / vs. March
Before · After
Before → After
Context
Jersey Club Football sells soccer jerseys online — club kits, national teams, retro drops, World Cup releases. Shopify store, US audience, competitive as hell because everyone's selling the same jerseys at the same time a big tournament hits. Facebook was the only channel running, and it had stopped pulling its weight. Not slightly underperforming — actually bad. CPMs climbing, CTR flat, the usual signs that an account has been running the same handful of creative ideas for too long and the algorithm has nothing new to reward. For a brand that needs to move real inventory before a season or a tournament window closes, that's not a slow problem. That's a 'fix this now or miss the window' problem.
The challenge
One channel running (Facebook), CPMs climbing, CTR flat, and a hard deadline before the tournament window closed. No backup plan, no creative pipeline.
What we did
- Built a weekly creative pipeline across genuinely different formats — native TikTok cuts, talking-head, product, studio.
- Leaned into content that looked like a fan post, not an ad. Native-style consistently beat polished.
- Tightened the ad-click to checkout path so winning creative actually converted on-site.
Outcome
This wasn't a lucky creative or a viral moment. It was a brand with one broken channel and a real deadline, and a system built to find what works before the window closed. Per Shopify, total sales grew from $26,123 in April 2026 to $210,643 in the 30 days from June 9 to July 9, 2026 — roughly 8× growth (+191% vs. the prior 30-day period, +39% vs. March). None of it from a sitewide discount. That's the model we run for every account: channel, creative, and site treated as one system instead of three separate line items.
Timeline · How it actually unfolded
Twelve weeks, mapped week by week. Here's the system, not the luck.
Audit + kill the bleed
Cut spend on stale creatives, rebuilt account structure, mapped ad-click-to-checkout path. No new spend yet.
Creative pipeline live
Weekly cadence of native TikTok cuts, fan-POV, studio, talking-head. First native-style hook beat every polished ad.
Open TikTok, scale winners
TikTok Ads account launched. Meta rebuilt around the same winning angles.
$26K → $211K, ~8×
Shopify total sales grew from $26,123 in April 2026 to $210,643 in the 30 days from June 9 to July 9, 2026 — roughly 8× growth, verified directly in Shopify. No sitewide discount.
Proof · Real dashboards
Real dashboards, zero editing. Judge the numbers yourself.
Screenshots pulled straight from the client's own ad and analytics dashboards. Same numbers we've been quoting on this page.
The creative
Here's what ran. Look at what doesn't look like an ad.
The gap between the polished cuts and the ones that read like a fan post is most of the story.
Want this for your brand? Book the 30-min call.
You leave with a 90-day plan whether we work together or not.